Our Client: International Operator
The Location: North Africa
The Technical Challenge
A well test was suspended due to lack of sanding information resulting in sand built up in tubing. It was therefore important to detect sand on surface for subsequent well tests and to determine the sanding propensity with respect to the drawdown imposed on the formation. To achieve this, reliable sand information must be available in real time so that decision that impacts on the wells’ productivity, well test data and safety could be implemented. BSW measurement would not suffice for the timely decisions required and certainly not possible at 100% gas production.
SMS Solution
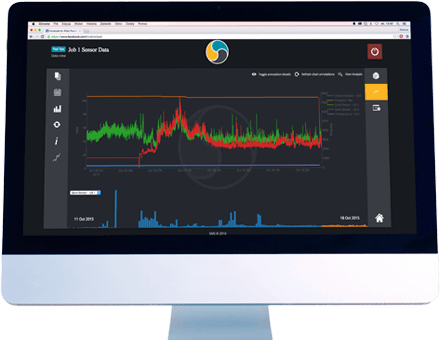
SMS deployed clamp on dual acoustic sand monitoring system located upstream and downstream of the dual pot sand trap which was part of the well test package. Sanding data from the acoustics sensors were outputted via SMS smart software located in the test company’s data acquisition unit. SMS Engineer correlated the sanding data with the wells’ flowing parameters to provide real time qualitative sanding information for managing drawdown and safely optimising equipment performance.
Value to Client
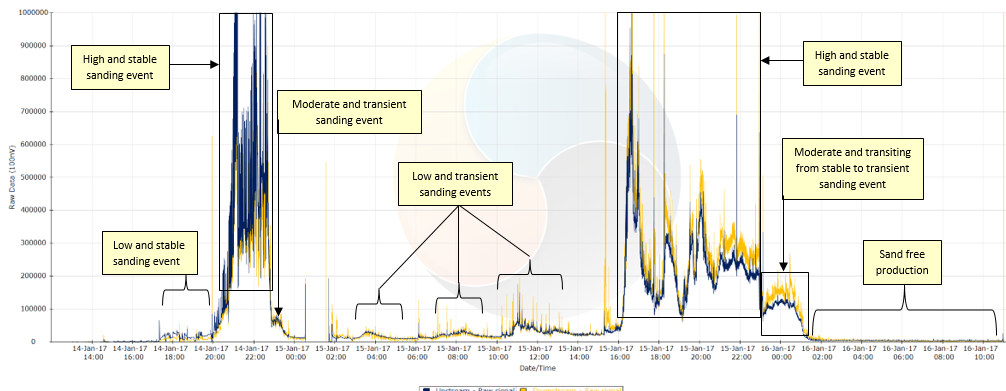
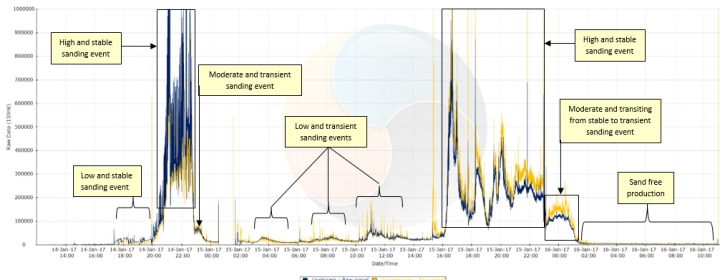
The clamp on acoustic monitoring system detected the presence of solids in the flowing fluid and the perfect match of the upstream and downstream acoustic signatures confirm solids flow through the sand trap. There was no appreciable differential pressure across the sand trap to suggest sand deposition as the grain size was much finer than the mesh size.
Instantaneous sanding data generated by the sensors in form of raw signals were interpreted and categorised as low, moderate or high sand production with second degree classification as transient, stable or increasing. For instance, if sand production remained constant at moderate levels, the flowing condition was kept constant for a period of time to ascertain the sanding propensity prior to any further action. However, if sand production became unacceptably high, immediate action was taken to mitigate against the potentially hazardous consequences.

The sanding information being available in real time enabled the operator to determine each well’s sanding propensity with respect to drawdown and to achieve maximum sand free rates for all wells. Also, SMS working in collaboration with the Well Test Company and the operator utilised the sanding information to safely optimise the efficiency of surface equipment for best well test results.
To find out how SMS can add value to your well test, just get in touch This email address is being protected from spambots. You need JavaScript enabled to view it.


